Business Intelligence Engine
Make better business decisions with visual reports and deep analytics.
D-Tools System Integrator has the capability to report critical project and product information across multiple projects. This provides business owners with a powerful business intelligence engine to drive visual reports and dashboards of key performance indicators.
The D-Tools Business Intelligence engine enables deep analysis of business activity such as sales activity, personnel performance assessment, vendor engagement, product usage, profit analysis and more. In addition to pre-configured Business Intelligence reports, SI makes it easy to create custom visual reports and dashboards to understand important elements of an integrator’s business.


g
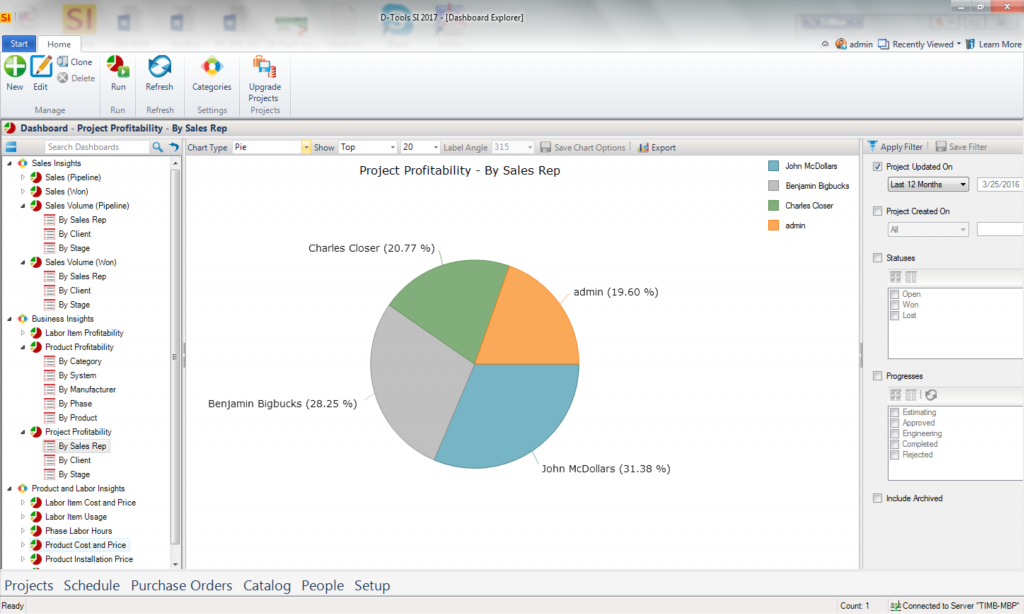
Utilize Pre-configured Dashboards
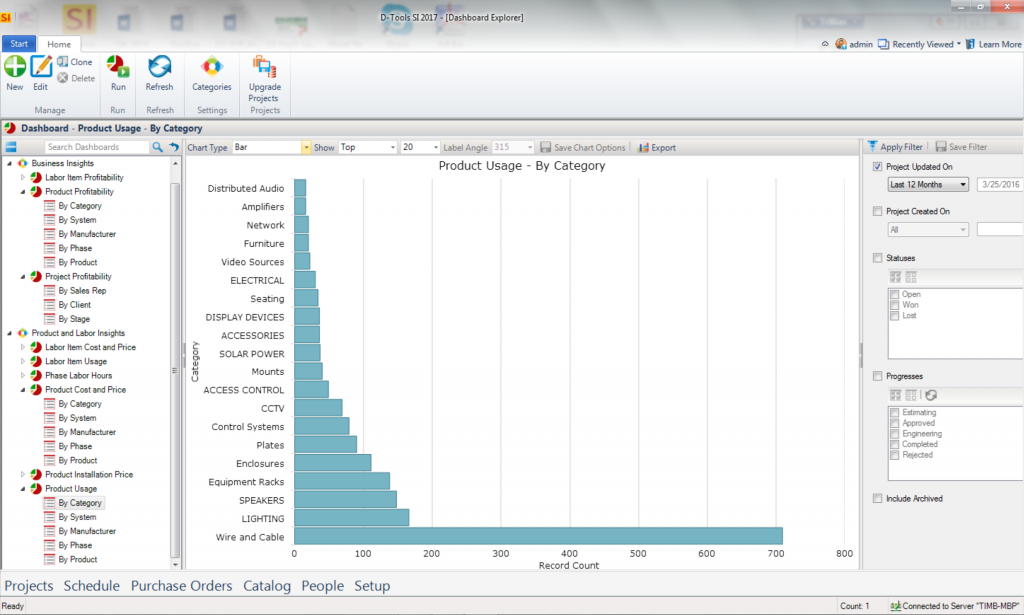
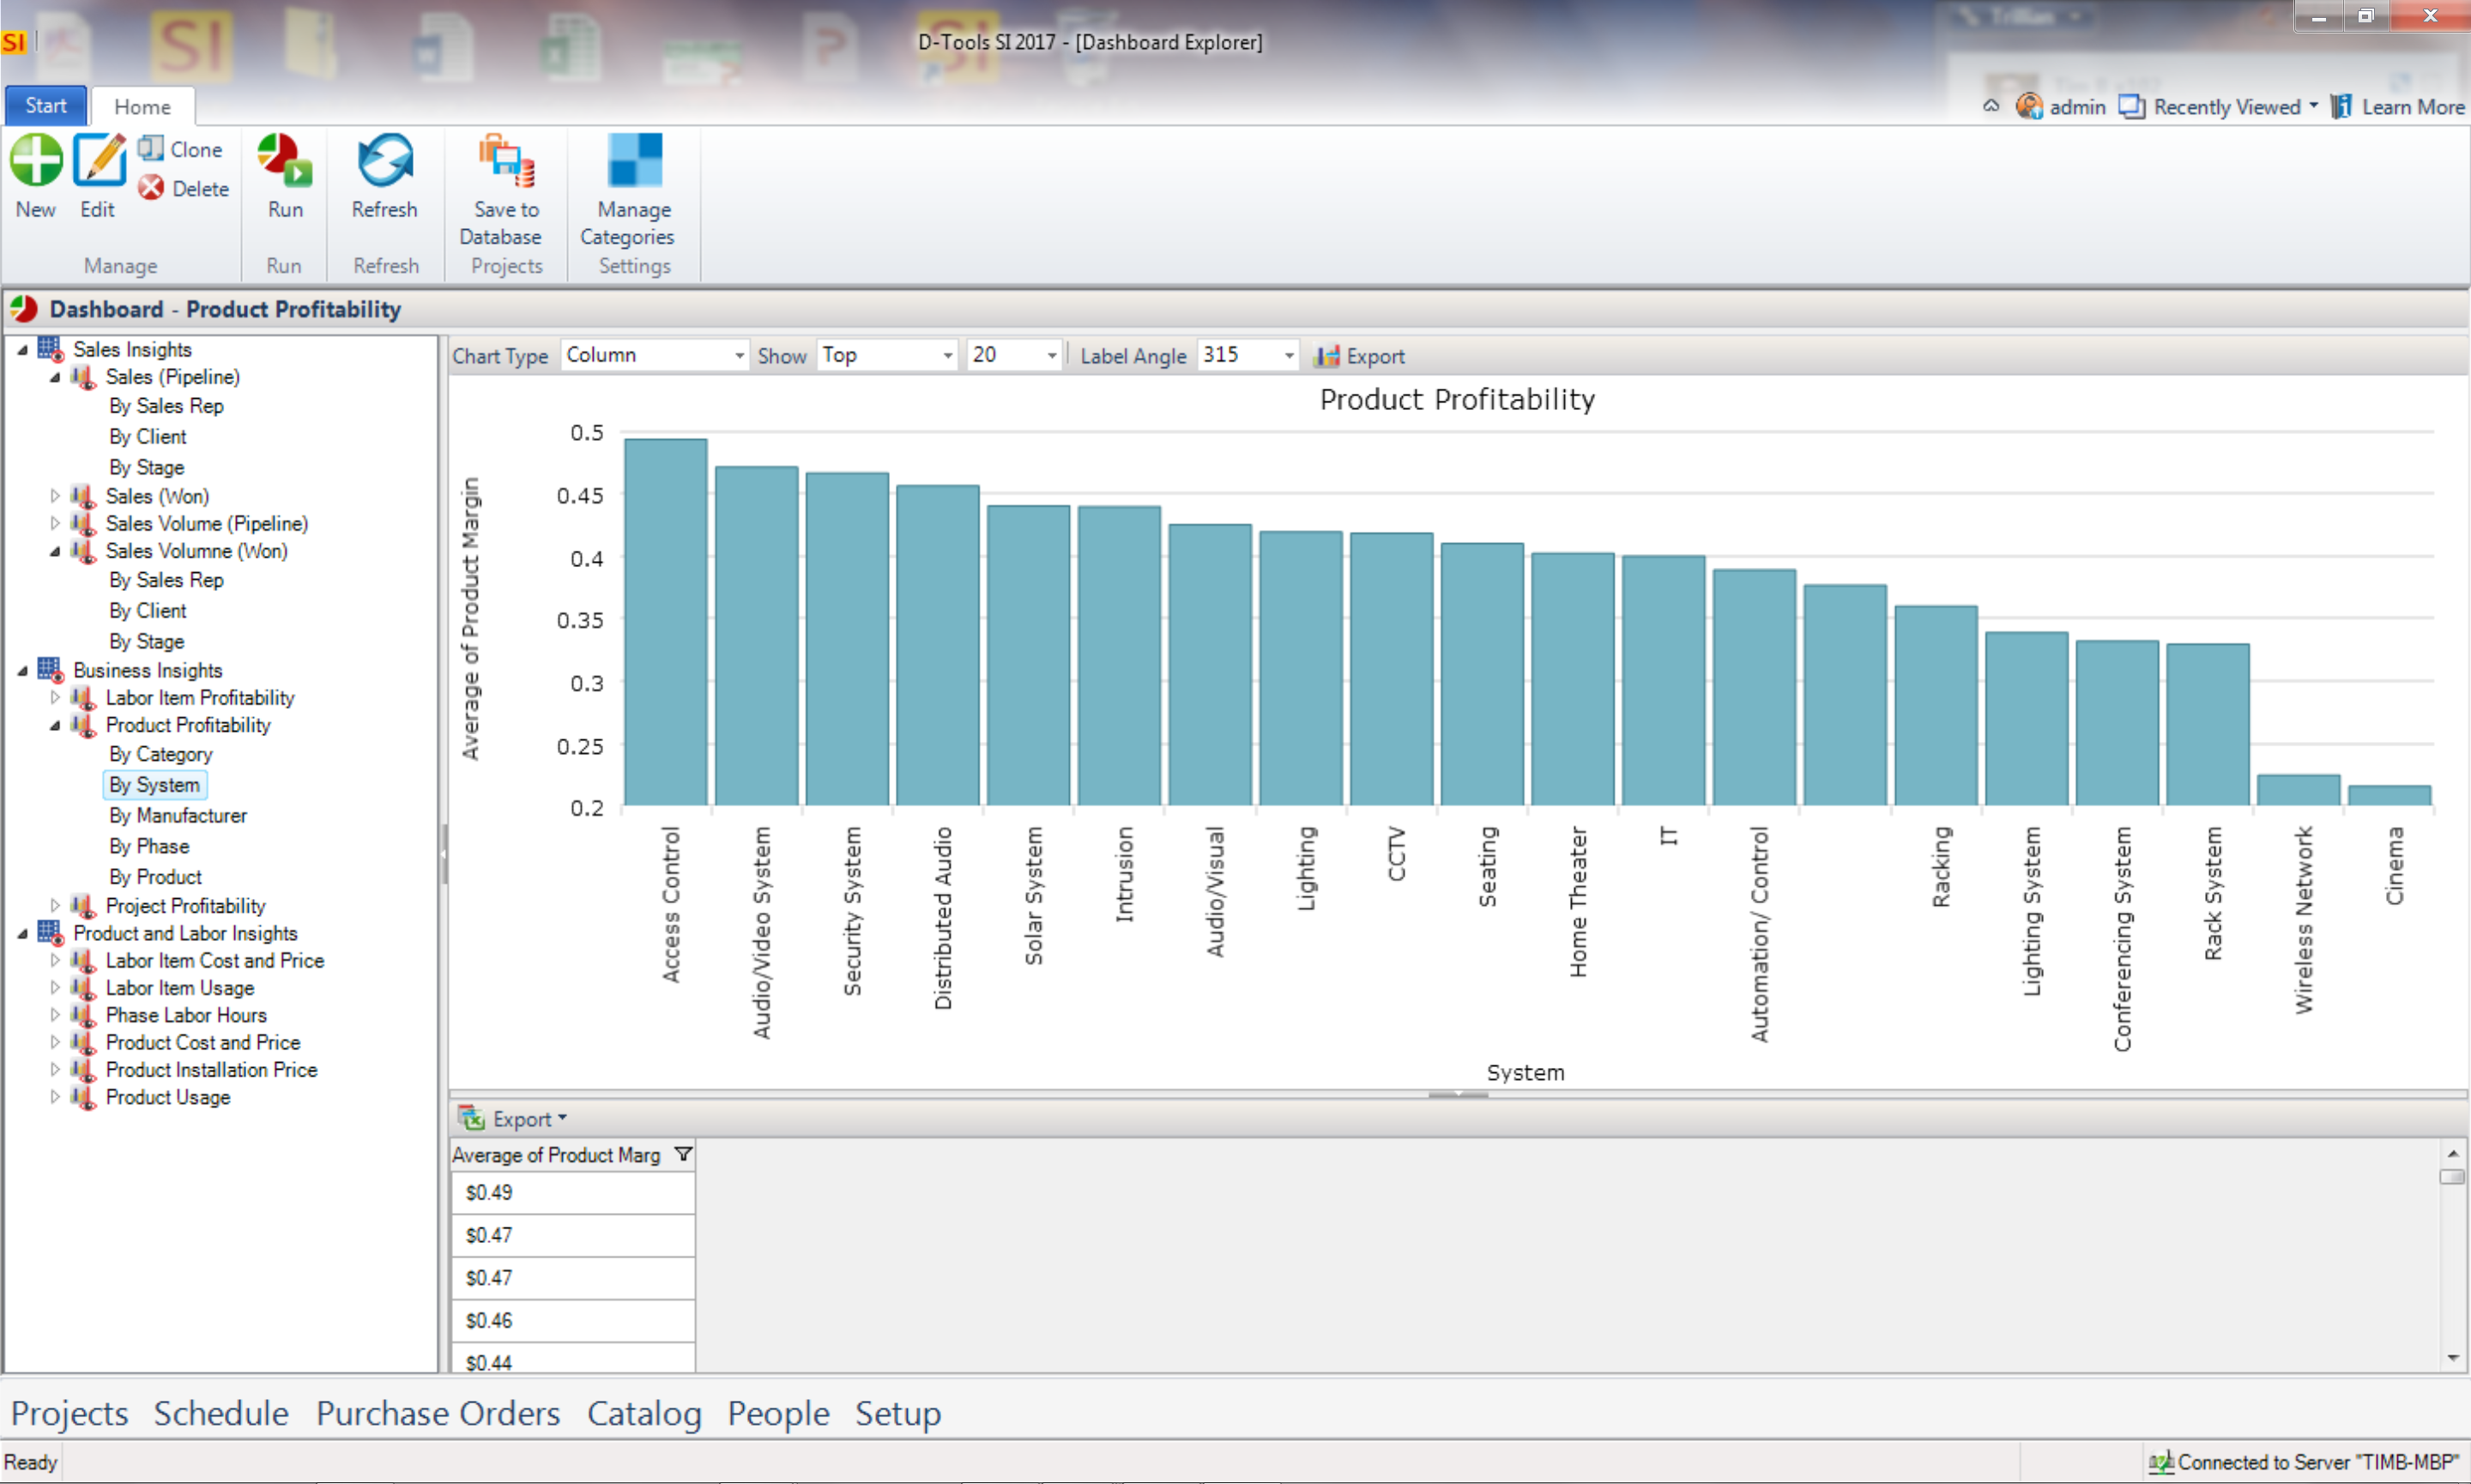
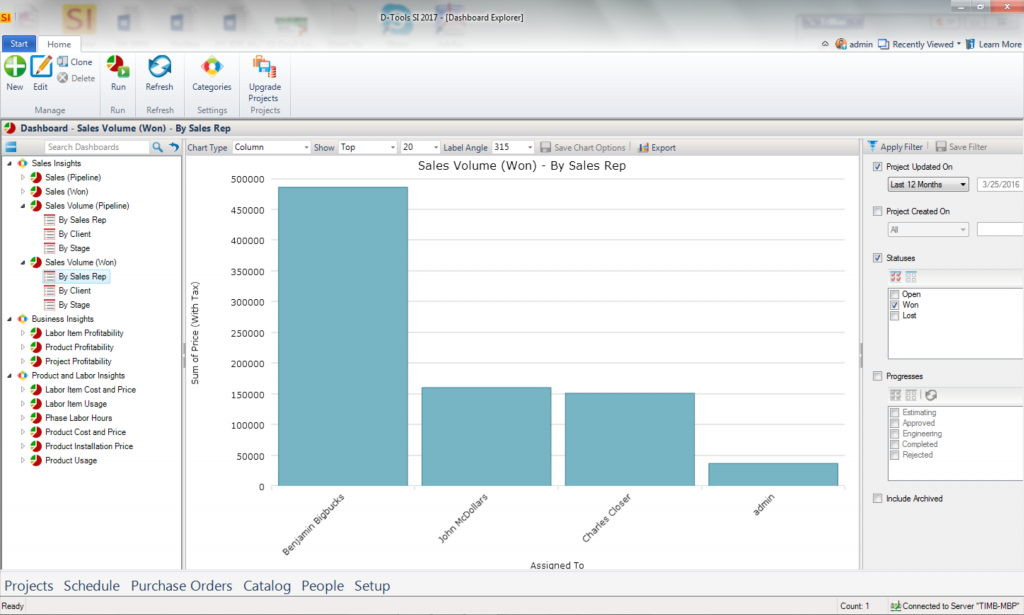
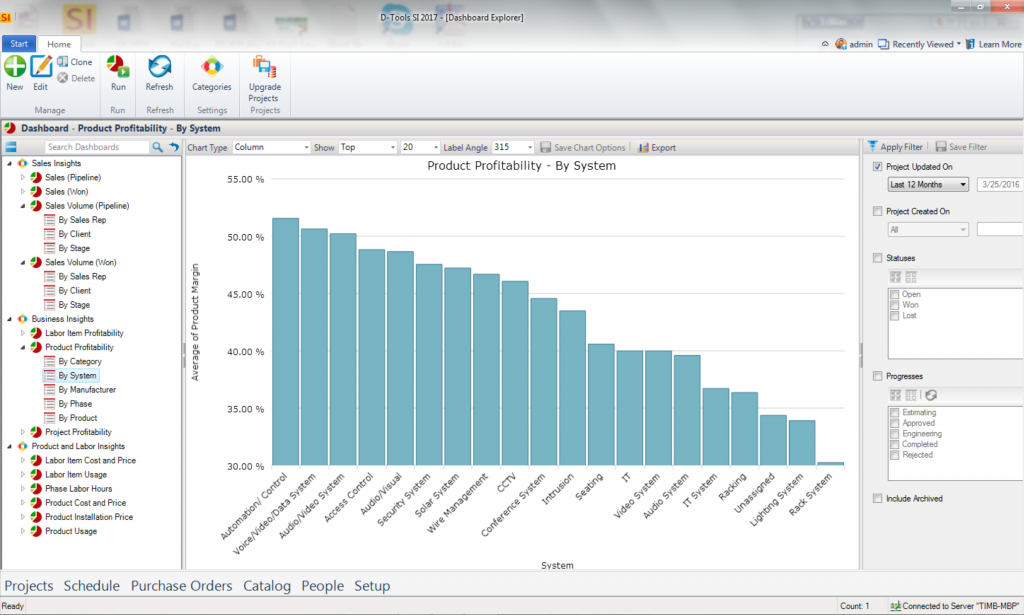
System Integrator includes pre-configured dashboards that provide detailed information on projects and project items. These dashboards can be filtered by date range and can be viewed as a chart or table. Pre-defined dashboards include project sales, pipeline (by project stage), top products sold, margin by product category, manufacturer, and more.
f
Customize with the Dashboard Wizard
System Integrator features a Dashboard Wizard that can be used to create, edit, and clone dashboards. SI enables two types of dashboards: Summary (for grouping and summarizing of data) and Tabular (simple table for lists). Dashboards can be configured from project and product information, then grouped, sorted, and filtered in order to display the desired information. Dashboards can be configured to report on current and archived projects.
Sales Volume
Sales Pipeline
Project Profitability
Product Profitability
Product Usage