
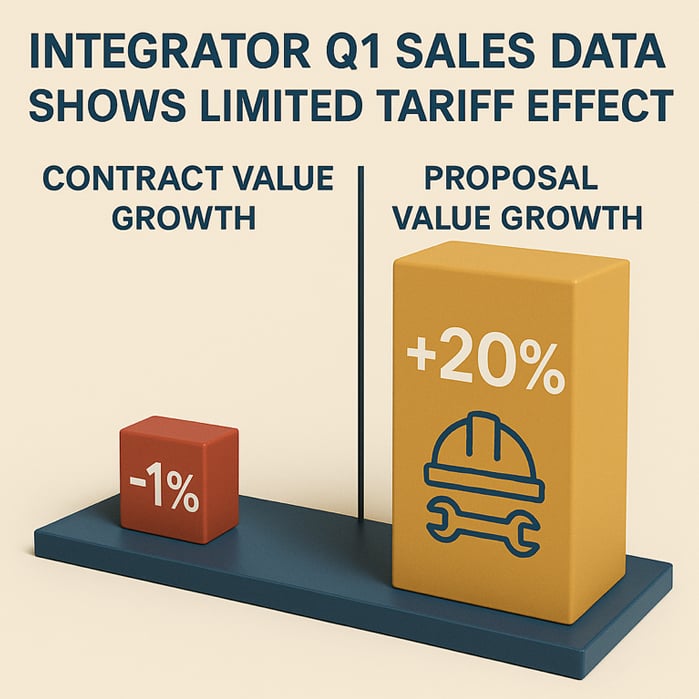
“What tariffs?” might be the question asked when looking at the sales data for the first three months of 2025. According to aggregate data from D-Tools Cloud software, there was a big 20% spike in the average value of proposals in the first quarter of the year, but that increase does not appear to have come from increased product costs. Indeed, more of the increase is attributed to labor than products.
Interestingly, while proposal values spiked, the average signed contract value actually decreased by 1%. The delta between proposal values and contract values continues to widen, indicating that value engineering/negotiation between integrators and clients is active.
These mixed results indicate that there was limited effect, if any, from the on-again/off-again seesaw tariff situation. Granted, many of the tariffs did not kick in until April.
Those are just a few pieces of info gleaned from more than 51,500 proposals and nearly 19,300 signed contracts in D-Tools Cloud in the first three months of 2025. The end-to-end software solution is used by more than 3,000 integrators to build proposals and manage their operations.
The ever-changing tariff situation has likely caused consternation among integrators as they create proposals using products from the D-Tools Integrated Product Library. Suppliers are actively updating their pricing information in the Library so it is the most up to date possible. The worry for integrators is specifying a product with a price today that might be totally different several months from now when they plan to purchase the product just prior to installation. It is not feasible for most integrators to buy products for a project many months in advance to store in their inventory and possibly disrupt their cash flow.
Q1 2025 Benchmark Datapoints from D-Tools Cloud
The Q1 2025 data from D-Tools Cloud can provide benchmarks for integrators to gauge the state of their own businesses against the general market. Some of the specific datapoint takeaways are:
8% -- The average number of proposals generated by an integration company rose 8% to 45 proposals for Q1 2025 vs. Q1 2024. The increase shows that demand remains strong for integrators’ installation services, and by using software like D-Tools dealers are able to crank out more quotes.
$43,837 – The average proposal value increased a whopping 20% in Q1 tis year versus last year. Surely, some of that is the result of the rising cost of labor and products. What amount of the increase, if any, might have been due directly to tariffs is unknown. .
5% -- The average number of installation contracts signed per dealer was 23 in Q1. That is up 5% from the first three months of last year.
$18,211 -- The average value of an installation contract fell by 1% to $18,211 in Q1 compared to 2024. That reverses a trend we saw last year where dealers clearly targeted larger projects. Although contract values were flat, it still represents a 7% increase over the past 4 years.
26% -- The percentage of a contract devoted to labor was 26% in Q1, which is up from 24% last year and from 22% four years ago. As noted, the increasing percentage of a contract for labor shows that the tariffs affecting product prices had little to no effect in Q1.
On May 27, D-Tools will present an exclusive webinar for i3 Partners that delves into more details on this data, and much more, including the shocking product category that is now the most commonly installed, surpassing TV displays. I3 Partners can register here.