

Make a better impression with “RTF” utilization.
Per my position within the PSG, I often get requests to “improve” or “enhance” a dealer’s client-facing documents. Here at D-Tools, we want to ensure you are able to present the most accurate and professional proposals and documentation to your customers, while providing the best representation of your company.
We have a great selection of stock reports (Proposals, Cover Pages, etc.) with available themes, and the ability to modify your reports with custom Company Information, Scope of Work, etc.
We also have Custom Reports which can be generated by our Report Designer, by working with the D-Tools PSG team to create them for you, or we can train you on how to create them.
And while all requests vary in terms of the look, style, and structure, the content of some of these documents, like the Company Profile and Scope of Work reports within SI, can be modified with our default RTF (Rich Text Format) attachment process.
Now while many dealers have used this process before for specific text inclusion, not all are aware that it can be used as a way to include graphics and/or specific image files. This could even include charts and graphs related to your project management approach.
Another area of report customization that I’ll include here as a bonus (to those of you interested) is the use of a project’s Custom Field to include a data value from another software integration in your reports. So for those of you using a 3rd party software like SalesForce, NetSuite, Hedberg, or Connectwise that have a need to bring data from that software to SI to then populate on a report, you’ll be pleased to read on.
Making Changes
With these thoughts in mind, let’s make an “RTF” document and then change the Company Profile report to start:
So as not to bore everyone with an MS Word tutorial, suffice it so say, you first need to create a company profile document in Word and save it as a “Rich Text Format” file type:
![]()
If you need further assistance with this process, simply search the web for detailed instructions.
Here is the default output value with a simple text inclusion from the SI Company Profile:

(Now keep in mind your header and footer theme selection may vary)
While there is nothing wrong with this document, let’s take a look at a similar output but with the utilization of an “RTF” attachment:

Now, while this is a very simple process in SI, the output is quite a dramatic improvement. Graphics such as logos, certifications, awards, and industry recognition achievements can easily be included.
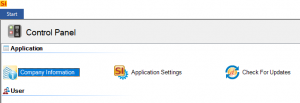
Here’s how it works…Proceed to the Control Panel in SI.
![]()
Next, select Company Information.
Then, select Profile (RTF).
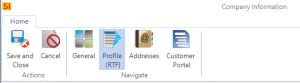
From there, left-click on “Attach”.
![]()
Then you need only navigate to the file you wish to include and left-click on “Open”.
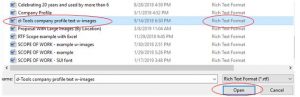
Now, like many things with SI, you need to click on “Save and Close” to record the change.
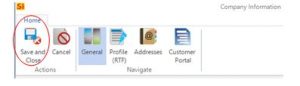
And just like that, voila you have attached an “RTF” file for inclusion in an SI Report!
The side by side comparison


So now let’s review how to do the same with the Scope of Work report within a Project.
First, let’s take a look at the default output with the inclusion of a simple text scope narrative.
And, again this is a very nice and appropriate document to share with your clients.
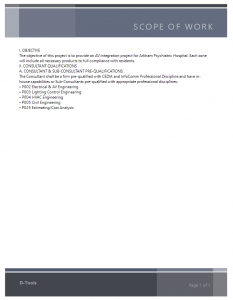
But what about this output…
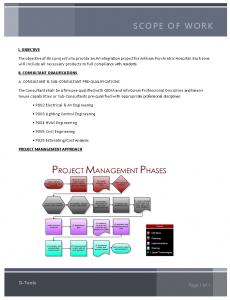
As you can see, details like bold text, bullet points with indentions, and flowcharts can now be seen in the very same report. But how did we get here…let’s take a look, shall we?
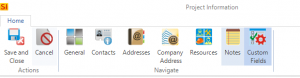
First, open the Project Explorer.
![]()
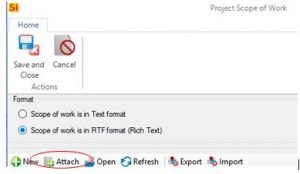
Next, proceed to the Scope of Work area of the project.
![]()
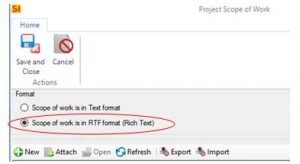
From there, instead of simply adding “dead” text to the scope section…
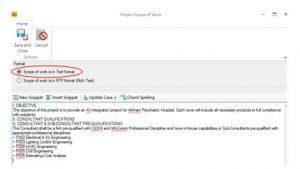
we’ll attach an “RTF” file created outside of SI by selecting this option.
The next aspect may be a little confusing so we’ll take it step by step.
– Instead of clicking on “Yes” to create the Scope
-We’re going to click on “No”.
– Then click on “Attach.”
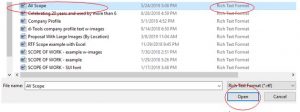
– And navigate to the actual file location.
– Now left-click on “Open” to load the file to SI and left-click on “Save and Close”.
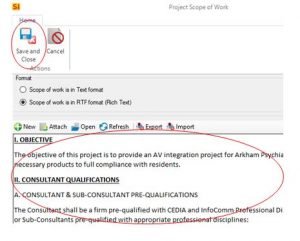
And just like that, you have attached another “RTF” file for inclusion in an SI Report!
The side by side comparison

Now for the bonus round.
How about the inclusion of a data field from a 3rd party software integration.
As always for this blog, we live most successfully when we keep it simple.
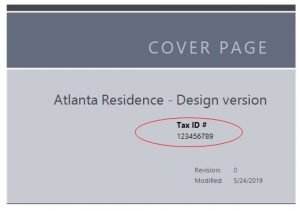
Perhaps you have a client that would like to have their tax ID number populate on the documents you present to them since they are tax exempt. That data may live in your CRM, accounting, or other external software and can be linked to SI via our API (or other integration).
![]()
Now for the “Custom Report” magic!
Once the data (tax ID #) is mapped to a Custom Field in the SI Project, it can then be placed into your report.
You’ll just need to know the “Custom Field” number to add it to your SI report.
![]()
Now it’s on to…
The Report Designer
While overall coding and structural elements may require some assistance from us, many dealers make these small, data changes and enhancements themselves.
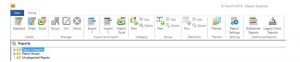
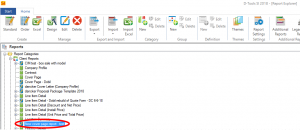
The first step is to navigate to the Home Page of SI v12 and select “Reports” in the “Projects” section:
![]()
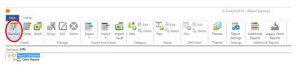
From here, you will enter the “Report Explorer”:
Now, let’s get the Report Designer open and start work. Simply click on the “Standard” icon in
the top left section of the “Report Explorer”:
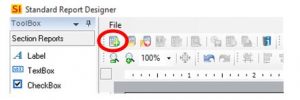
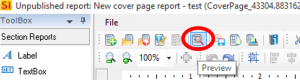
The Report Designer will open and you will next see this screen:
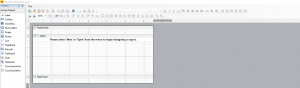
To modify your report, select the “New” icon in the top row of graphics just below
the “File” designation:
You will then see this:
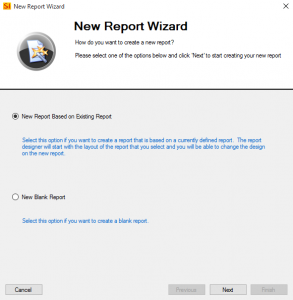
The New Report Wizard opens with two options. Select the top, defaulted option “New Report
Based on Existing Report”. Do not select “New Blank Report”.
The next screen will populate a list of reports:
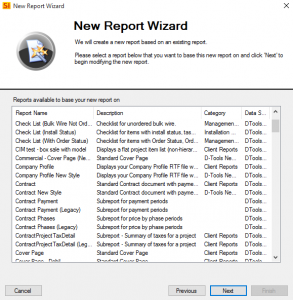
Select the desired report for modification from the list and click “Next”.
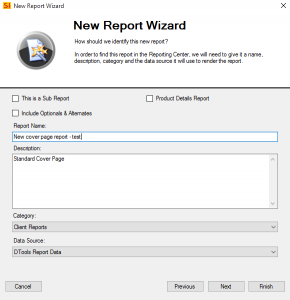
From here, you will need to name the new report.
(Perhaps something with “test” in the title until it is ready to share with your team.)
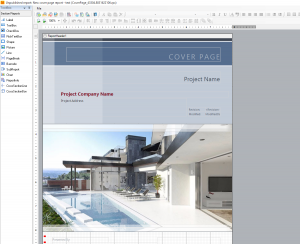
Now you can simply press “Finish” in the bottom right corner to launch the existing
Report in the Report Designer for modification. The result will be something like this:
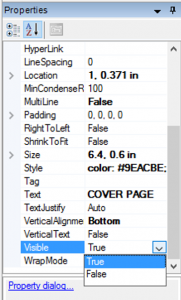
Important note before you begin customizing your document, some graphic items within the
report are “hard coded” and cannot be deleted or modified without breaking the VBA (Visual Basic for Applications) code.
To test this, simply execute a “Preview” after any changes to ensure code integrity.
Any items that cannot be modified can have their “Visible” status changed from “True” to
“False” in the Properties section in the bottom right corner of the Report Designer:
Making Changes
With these thoughts in mind, let’s add that Tax ID number to the report. You can grab the Custom Field from the Data Explorer in the top right-hand corner of the Report Designer:
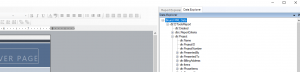
From there, “left-click” and hold on the Custom Field you need to place in the report
and drag it over the design environment:

(You can grab both the name and value of the desired field.)
You will end up with something like this:
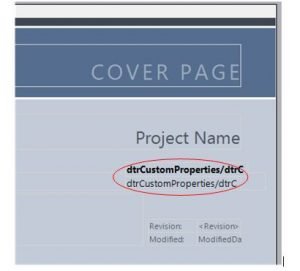
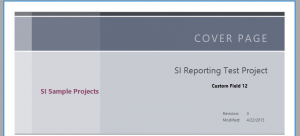
And here is the test result: (use the Preview option to generate “in-progress” results.)
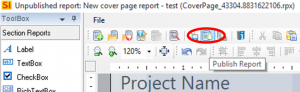
Now that the report has been customized, we need to “Publish” out to the software for testing
beyond the preview data.
This is accomplished by clicking the “Publish” icon in the top row of executables in the Report Designer:
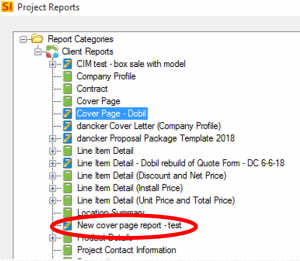
The new “test” Report is now active in your Report Explorer…
as well as in your Projects:
And now the end result should be something like this:
Wow! Just like that, we’ve completed your “customized” report within the SI Report Designer in SI v12. And all with absolutely “zero” coding and minimal configuration of settings and features.
Hopefully, this will enable your team to take a few steps towards enhancing your report documents.
In closing…
These are just a few examples of what can be done with D-Tools SI report environment.
For more information on these and other features of SI, please see this link: D-Tools SI.
You can also get more detailed information about v12 via our upcoming webinars or by enrolling in SI training with our PSG team.
And don’t forget, that’s why we’re here…to ensure your success with our product! Be sure to check back here next month for more on D-Tools SI v12!