How much did that job cost us? “Job Cost” reports are now live in SI!
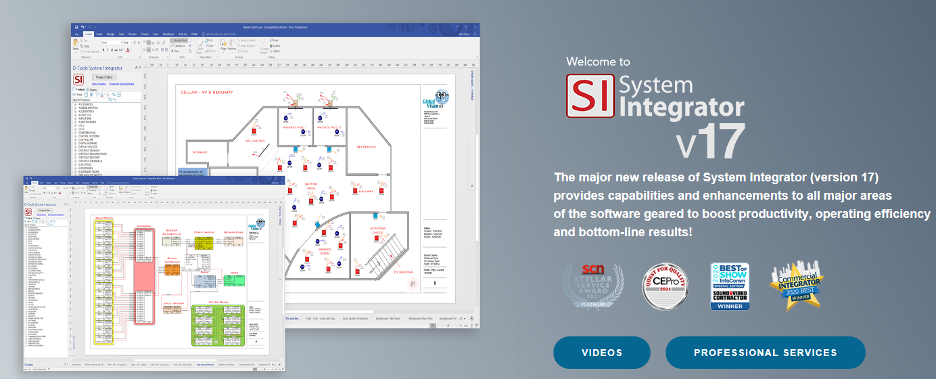
Continuing in our presentation of new SI features in D-Tools latest product release, version 17, this entry will focus on the “Job Cost” reporting aspect now live within the Project Explorer. Check out our previous article on one of our other new features, Time Sheets. Click here in case you missed that one.
This aspect of an overall evaluation of the dollars and cents after a project’s completion is sometimes a bit of a challenge for even the most sophisticated “reconciliation” softwares. That’s where D-Tools aims to help. By entering exact product and labor cost values along with time sheet entries from the field techs, you can now to leverage this data to get a true and complete understanding of “where the money went” to borrow a phrase.
What exactly is a “Job Cost ” report?
Essentially a Job Cost report is a presentation of a data evaluation that brings together (in a sharp focus) the variance in actual and estimated product and labor cost from within an SI Project. We can also narrow this view by selecting either an actual job costing report or one that looks at Revenue or an apparent Backlog of revenue. For today’s session, we’ll get started by reviewing the actual job costing aspect of this feature set.
Where to Start?
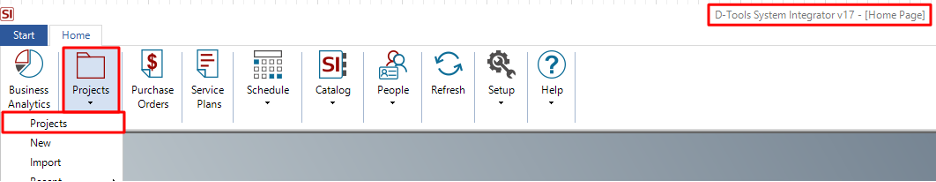
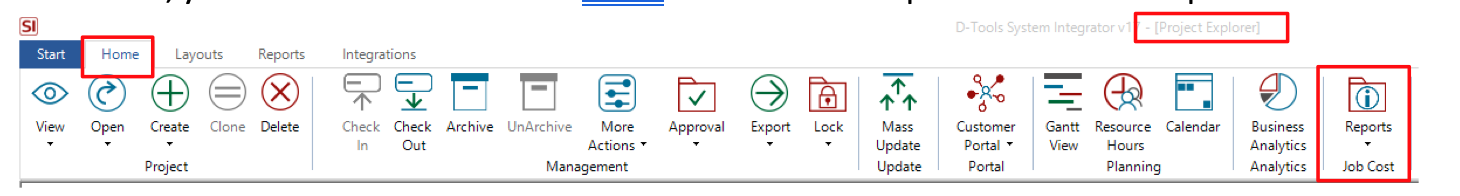
To access this report, you’ll need to proceed to the Project Explorer which can be launched directly from the Home Page of SI:
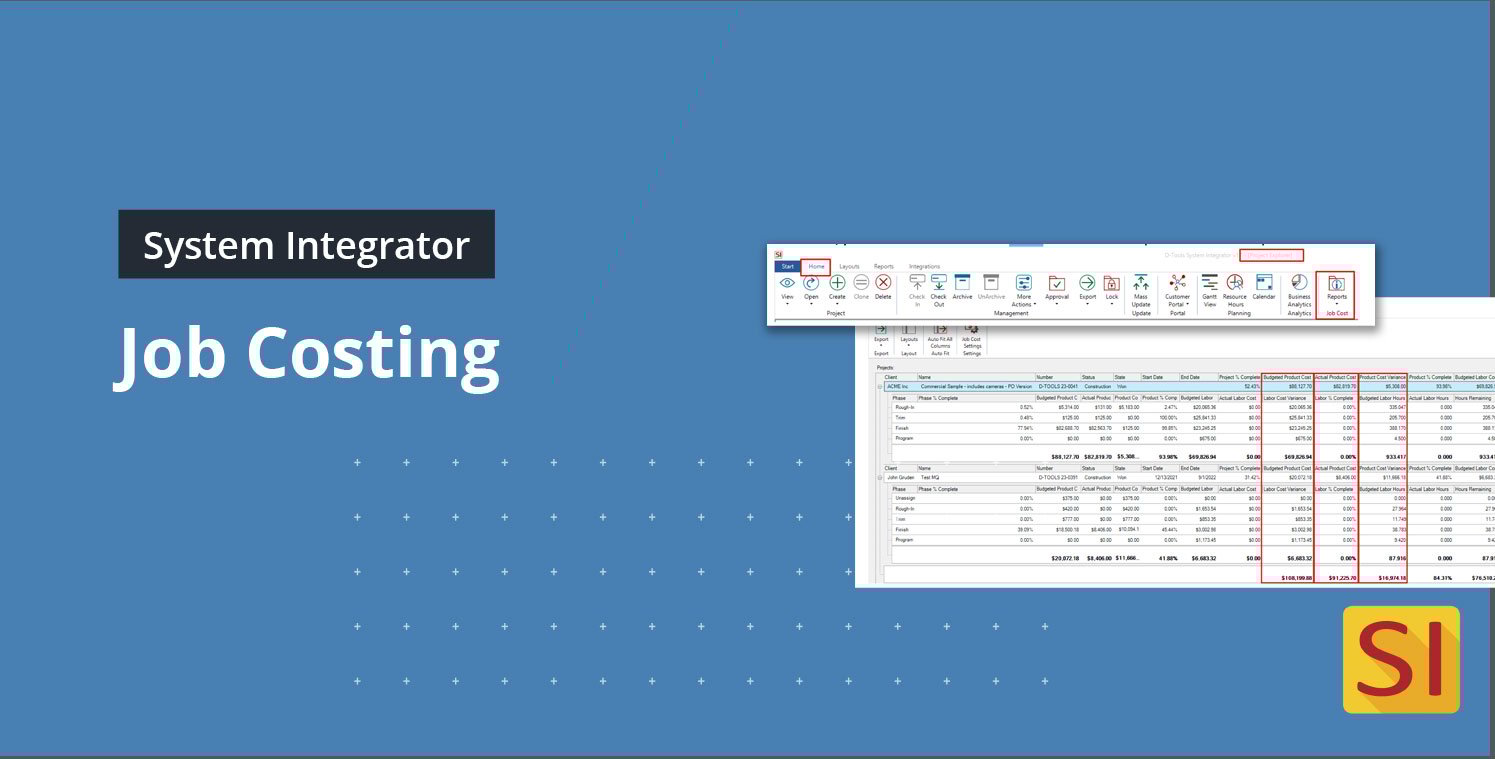
Once there, you’ll see the new icon in the Home ribbon labeled Reports in the Job Cost partition:
Just prior to running these reports, you’ll need to select at least (1) preferred project so that appropriate data can be loaded. Meaning, if you run these reports on Projects that have yet to commence, you may get a set of zeros across the board. Keep in mind that you can highlight multiple projects to see results for multiple jobs.
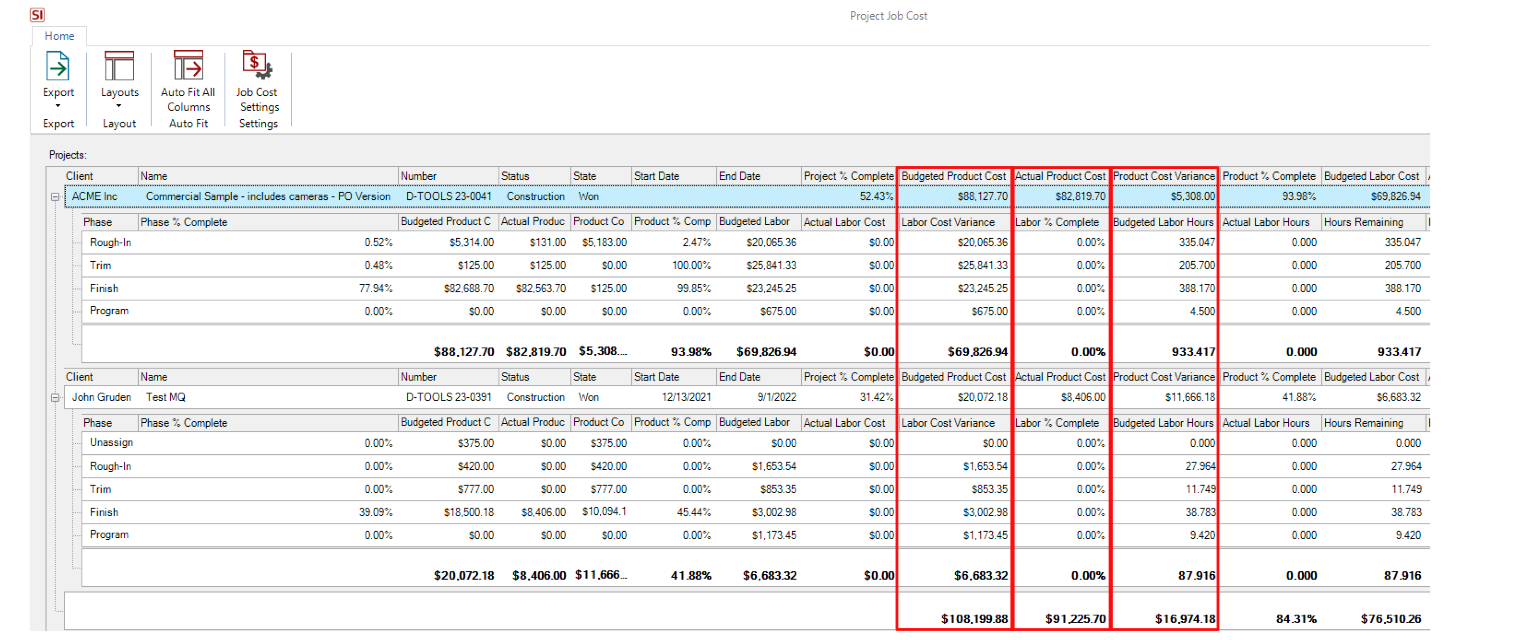
Once appropriate project choices have been made, simply left-click on the Reports – Job Cost icon and select Job Cost to see a result something like this:
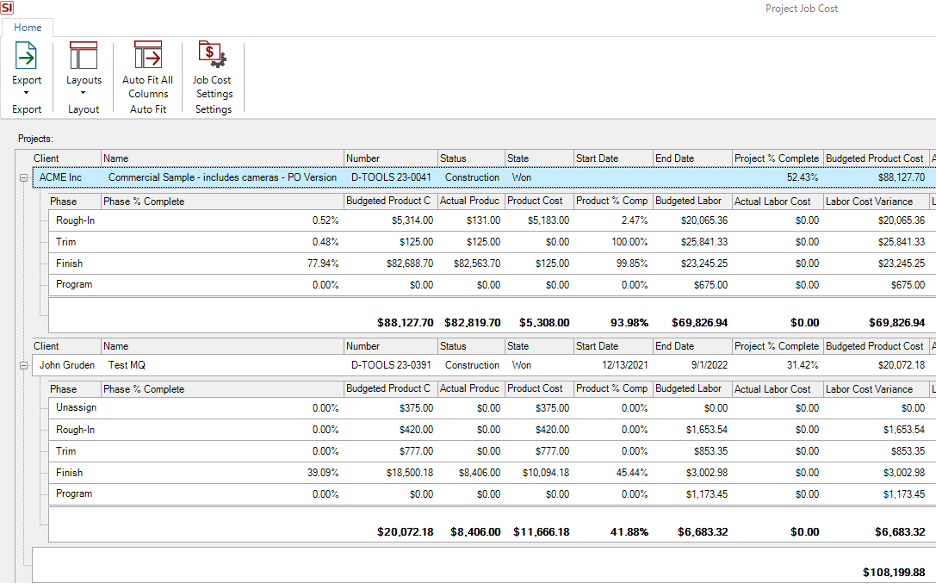
As usual, with some data presentations in SI, there is a lot to look at here. So, before diving in, let’s step back and review a couple of options and/or settings.
First and foremost, the Job Cost Settings icon: 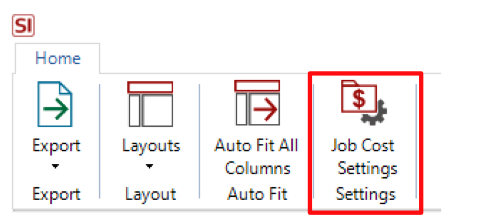
Here you’ll see options that will determine when values will be available to be included in such reports
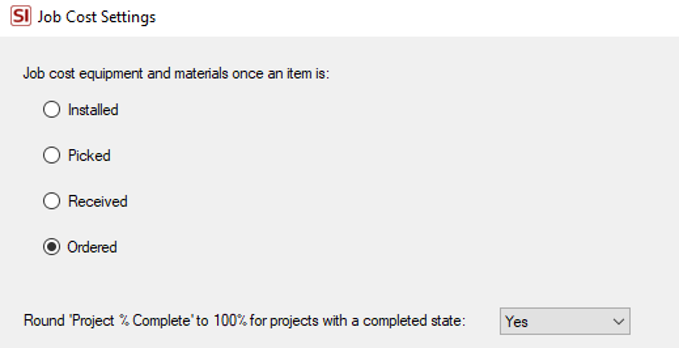
Labeled such as they are within SI, one could look at this in terms of when exactly do we as a company incur the cost of payment with regards to items. Is it when they are ordered, received, picked, or installed. This is somewhat of a reverse order presentation from top to bottom in terms of the process flow of events. Consult your internal accounting team to determine what may be the best option here if you’re unsure.
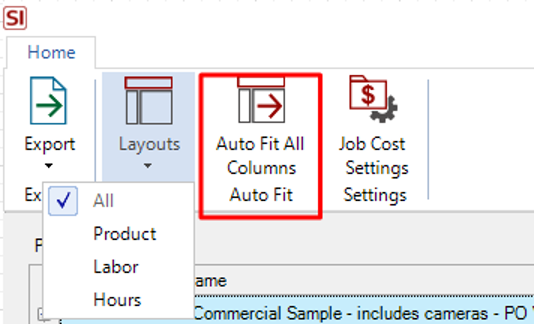
Once this is done, you can then proceed to click on the Layouts icon to select exactly what tiers of data you’d like to review:
By default, you’ll see all data available in this view but you do have the option to narrow that selection down to Product, Labor, or Hours. As mentioned, there is a fair amount of data available here for analysis so it may behoove you to choose an appropriate section to review.
No matter your choice, you will be best served by next clicking on the ubiquitous Auto-Fit all Columns icon to help display the data in a more optimized format for your screen.
You can then start to dive deep into the presented data and conduct your analysis on any one of multiple points of interest:
So why does all of this matter???
Well, that is the “$64,000.00” question, is it not? To put it simply, this is a much sought after feature enhancement within SI that now provides you with real time data and analysis directly from values populated into an SI Project, Time Sheets, and from our Mobile Install platform. It also now keeps all this data home within SI so that you don’t need to export this data outside of SI (although you can of course).
Again as I’m sure you’ve heard and read before, the name of the game in this industry is “PROFIT” and, if you’re in this game for any other reason, you may want to reevaluate and seek success elsewhere.
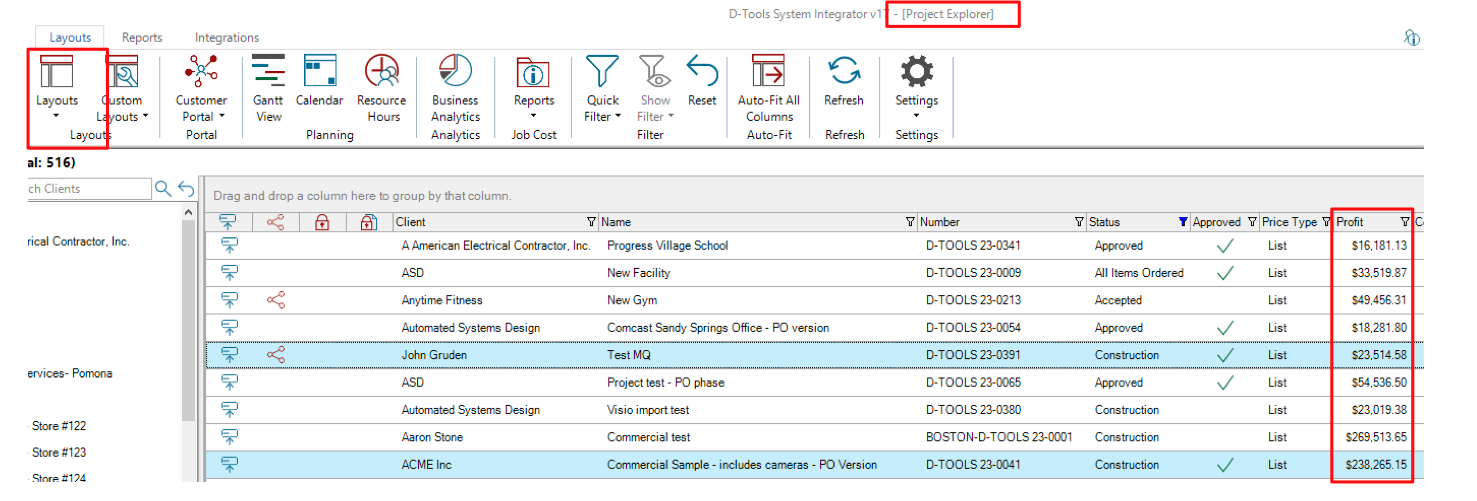
For those of you in it to win it, this data extraction is such an important process of this feature in SI v17. We have actually recently added Profit as a data column in the Project Explorer to save you from going a level deeper in the Job Costing report. Just change your Project Explorer Layout to Price and enjoy!
For some of us, it will only be after hours of back and forth with a client, weeks of PO’s, and perhaps months of installation deployment time that these numbers will start to take shape. But you can sometimes get the transit data you need while a job is in progress while you’re ultimately awaiting completion to see the final bottom line.
Since there is much more to explore here, we’ll follow this up with a look at how the Revenue and Backlog options can help you both in the short and long term. Suffice it to say for now, you can have actual, real cost data from any given Project and be able to review all of these values in order to determine your actual PROFIT!
Well, there you have the latest in D-Tools SI v17 analysis and innovation!
As always, we are reviewing your Feature Requests to determine our best step forward and next course of action with future SI product releases…so “keep’em coming”!
Hopefully, this presentation of just some of the many recent feature additions to SI will not only improve your team’s efficiency and effectiveness, but will also keep the needle moving in the right direction as you tackle all the challenges of this year. We will continue to present new features from our latest release (v17) to enable your team to get more and more out of our System Integrator solution.
In closing…
For more information on these and other features of SI v17, please see this link: D-Tools v17. You can also review our other videos and our usual support documentation.
You can also get more detailed information about v17 via our upcoming webinars, or by enrolling in SI training with our PSG team.
And don’t forget, that’s why we’re here—to ensure your success with our product. Be sure to check back here next month for more on v17.