
We hear a lot these days about KPI’s and various metrics in our industry. For clarification, KPI is an abbreviation for Key Performance Indicators and metrics is a sort of catch-all term for measuring performance/progression of actions related to project deployment. Not that the two are mutually exclusive, but for our purposes here, we’ll treat them as two separate areas for data analysis.
While your team’s needs for each of these may vary, suffice it to say, that SI can deliver some of these essential and formative values as you analyze, not only your team’s individual performance, but also whether or not your jobs are profitable and delivered in a time efficient manner.
For many of you (even our long time users) this type of data extraction and review will be a change in how you see and use SI. As we like to say, better data in equates to better data out. This approach be quite a change in usage of the SI platform but should be welcomed by all involved. A change for the better you might say.
Now speaking of change, don’t forget our recent offering on the fundamental change in SI known as Labor Types. This enhancement merits thorough examination so for those of who missed this prior entry on the aforementioned Labor Types, please click here to catch-up this one. It is definitely worth your while.
What are KPI’s in SI?
How can SI help with this?
For starters, most teams are very interested in how the sales team is doing and what are the projections for where we are going as a sales team? This is a great place to start with your KPI assessment in SI.
For example, perhaps you want to assess how many projects are slated to close within the next 30 days.
This is where the SI Business Analytics (formerly Dashboards) can contribute. Below is an example of what you could get:
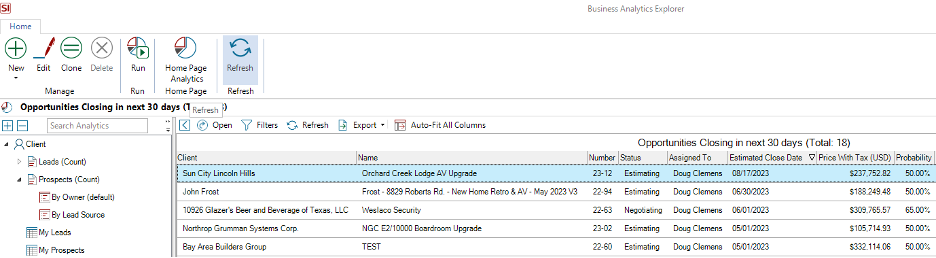
Here we see Project opportunities set to close in the next 30 days.
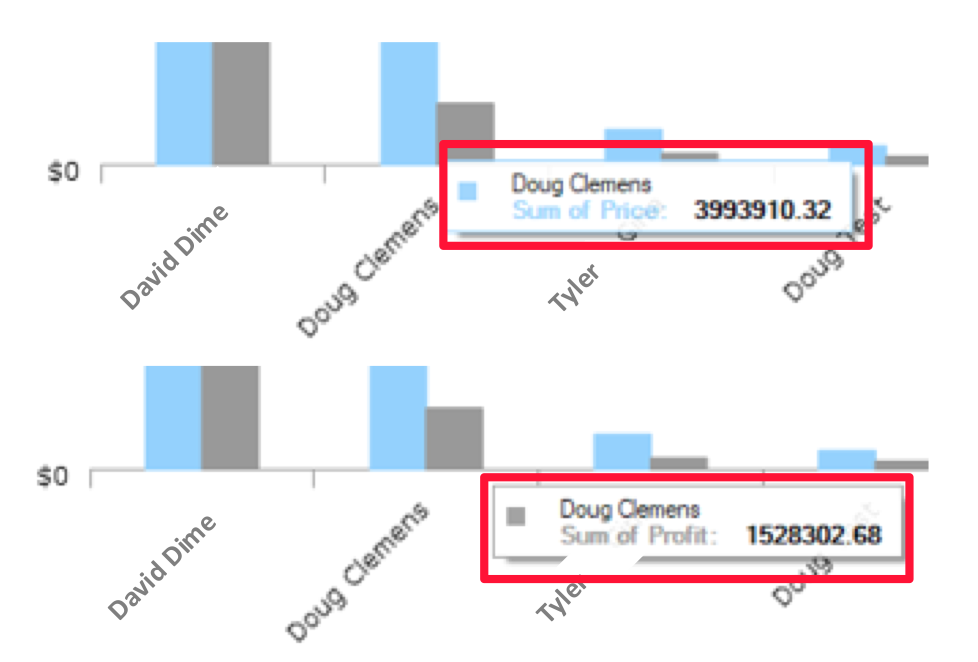
Perhaps you prefer to see sales numbers over a set period by the individual estimators on your staff. No problem, the Business Analytics interface gives you free reign to create the exact data presentation you require for just such a view:
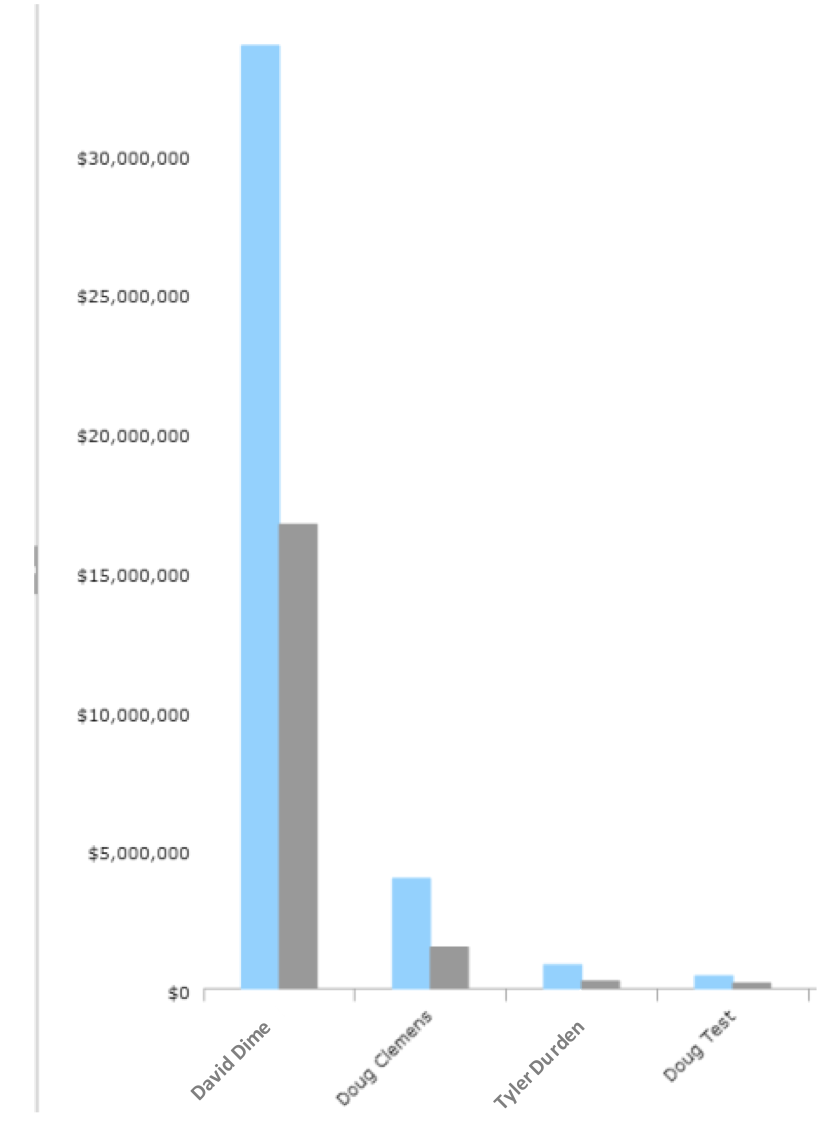
Here the (2) columns above are structured to present the total sale and profit values listed in your SI Projects. Hovering over each will offer a sneak peek at the details.
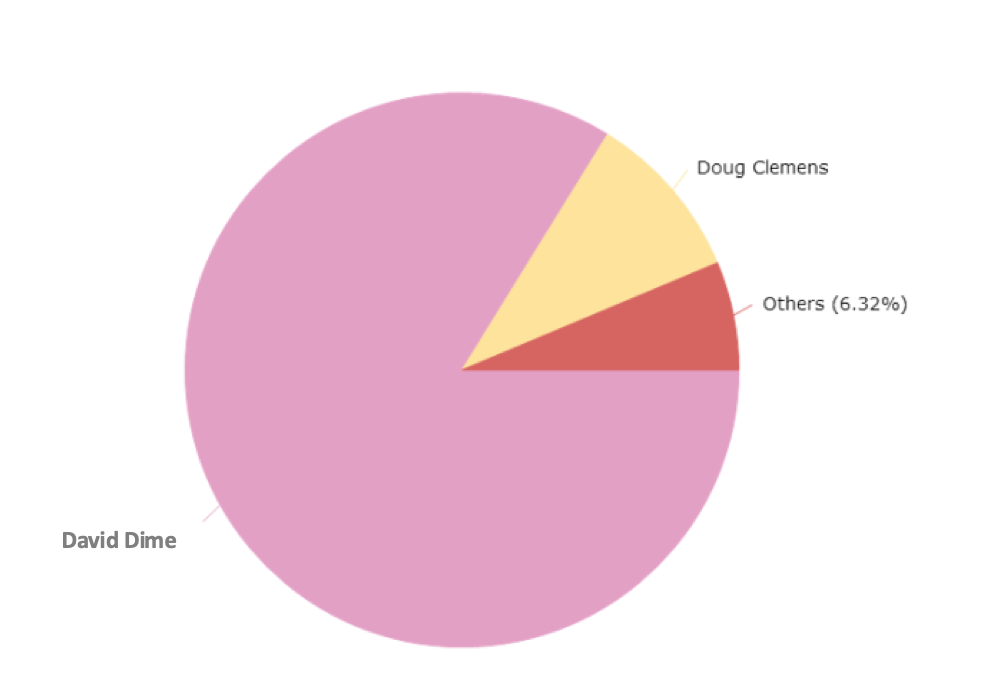
Just to give a further example of the flexibility of the Business Analytics interface, here you see similar returns in a pie chart view:
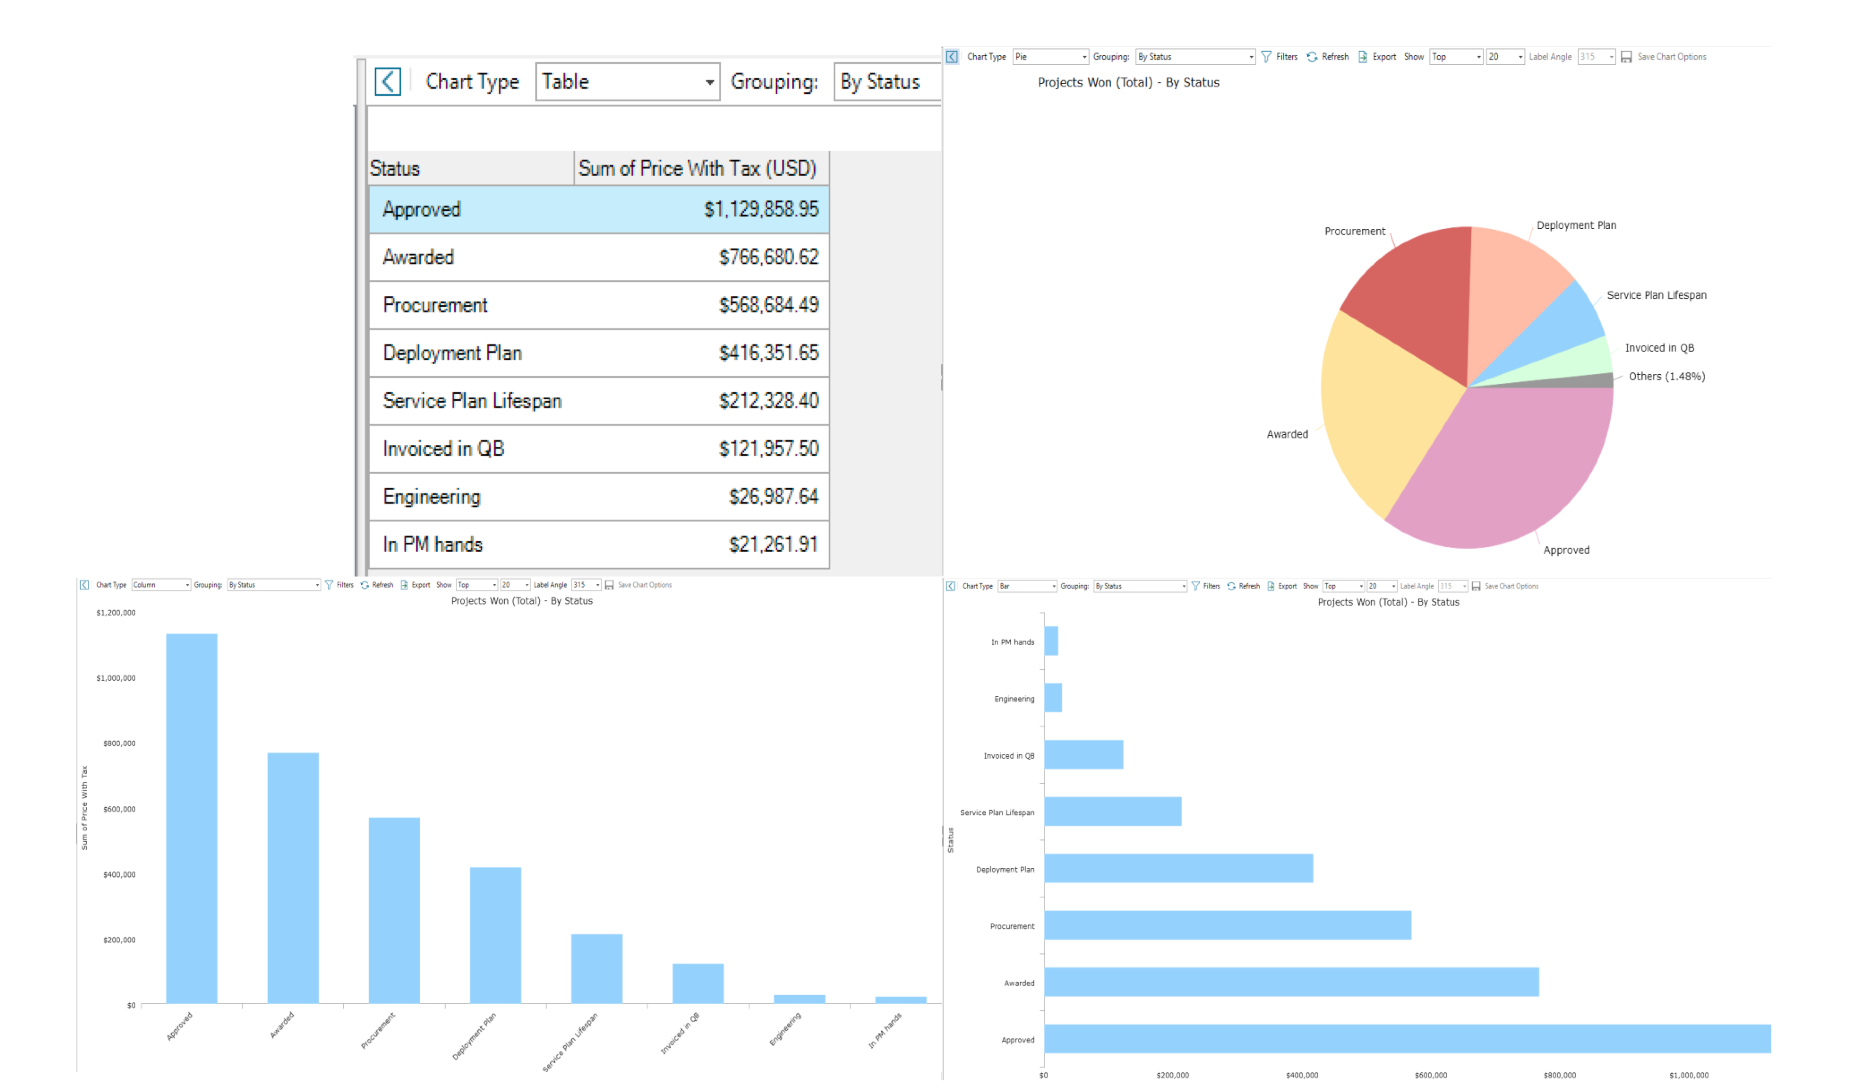
This switch in the style of the presentation of the data is easily done on the fly as you can see multiple display options of Projects Won data below here:
I recommend that you and your team explore the Business Analytics interface for all such needed values that if can offer.
Beyond the Business Analytics feature, you could also use Layouts in your Project Explorer and then export that data to a CSV file for further analysis:
A custom Layout could also be helpful here to succinctly organize the data you seek as well as filtering by date range and sales person.
For another KPI option, you now have the resource of Job Cost reports in SI.
Accessed from the Project Explorer, key data points regarding Revenue earned or backlogged can now be seen:
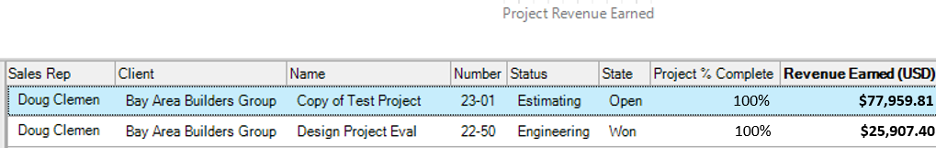
Another tool where filters and date ranges can yield very relative information for your team’s sales, revenue, and profit analysis.
This review here is really just the tip of the iceberg in terms of how your team can maximize such potential usage scenarios.
How metrics can be assessed in SI?
How does SI help with this?
For this presentation, we’ll switch our perspective to analyzing values related to labor and the deployment side of the operation for a moment.
Perhaps you’d like to know about how a certain installation is progressing in terms of the hours and dollars budgeted. Here, we would again turn to the Job Cost feature in the Project Explorer and run the actual Job Cost report.
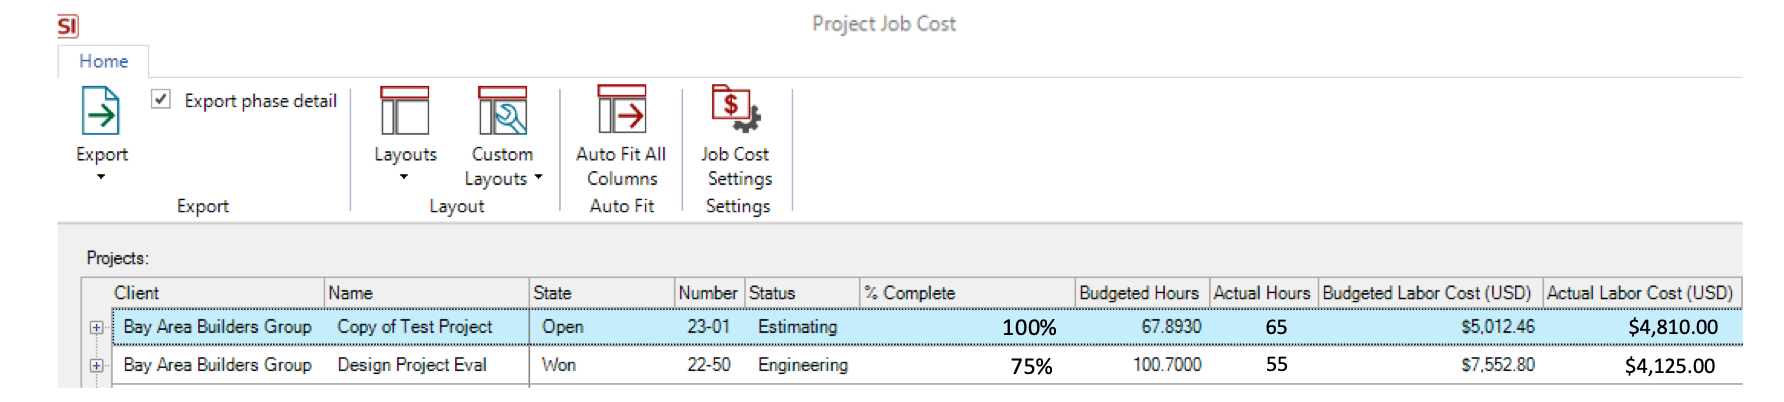
Here we can see the percentage complete along with budgeted and actual hours as well as the corresponding Labor Cost. Again, you can use a custom Layout to focus on the exact data columns you want to analyze.
Another way to assess how your installation team is doing, say from a more individual perspective, is to utilize the Time Sheet mechanism in SI.
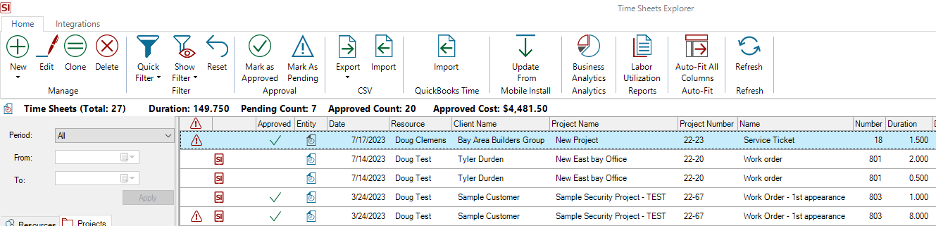
This data is directly related to how your field team is tracking their labor time along with activities such as travel and other field utilizations via SI’s Phases.
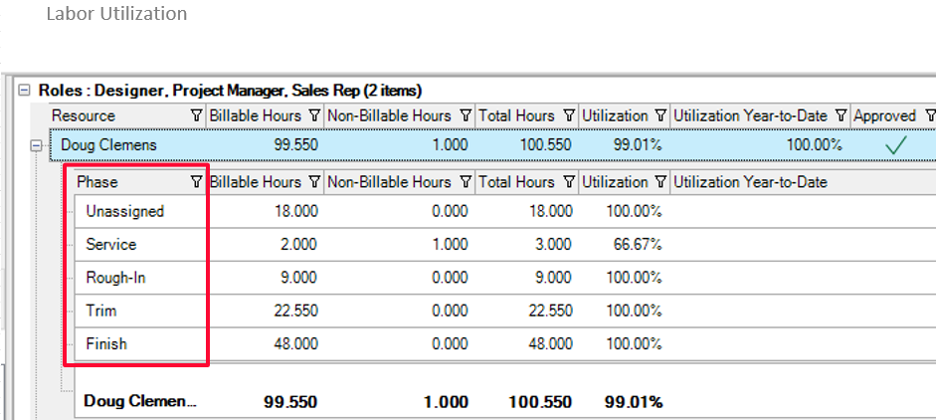
Above here, we see values from the Labor Utilization report in the Time Sheets module. This is where data can then be exported to CSV for further number crunching.
Turning the perspective back to sales for one final entry here, let’s talk about a metric to assess if your team is a) selling a specific item you’ve requested they propose and b) if they are consistently selling above or below a client’s stated budget for a project.
For the first item, we’ll turn to the Catalog (Product Explorer) to review and little known feature in SI called Find Usages.
Here we see a snapshot of (2) products and the result of the execution of the Find Usages in Projects:
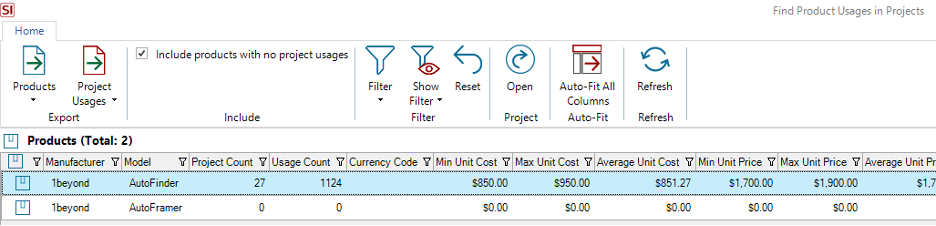
This data tells you how the team has been heeding your directive regarding the inclusion of specific products in bids (or the lack thereof).
In this view, we can even dig a bit deeper and see how many of the actual items have been procured by your team and put to a PO by executing the Find Usages in PO’s feature:
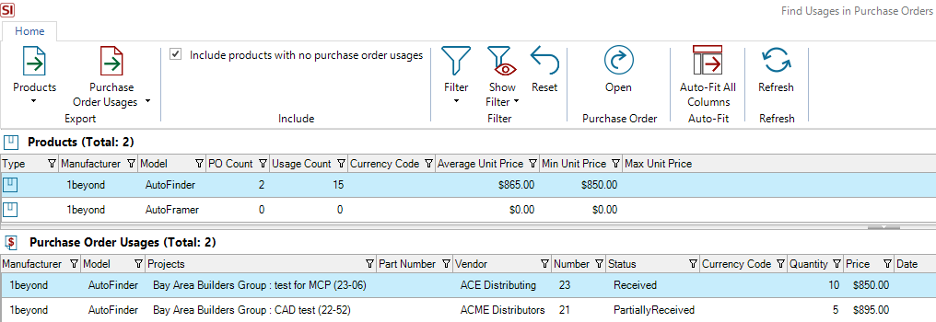
Again, like so many of these data/records returns that SI offers, this presentation can also be exported to CSV for sharing with other software platforms or just for review in Excel.
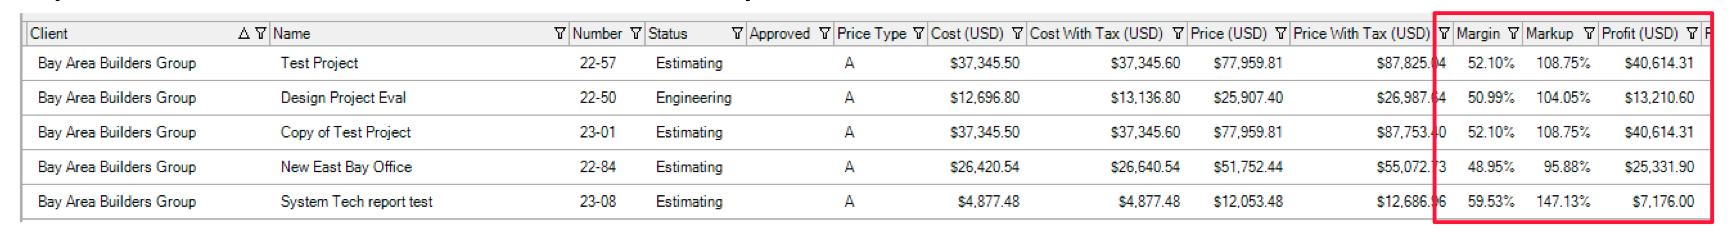
On the second item listed above, I was always very interested in knowing whether our sales staff was closing jobs above or below an established budget number for a given bid. Now sometimes this was an arbitrary evaluation or an educated guess but nevertheless, it is a good evaluation data point to see if, at the pressure of the close, does your team stand firm or collapse in order to win the bid.
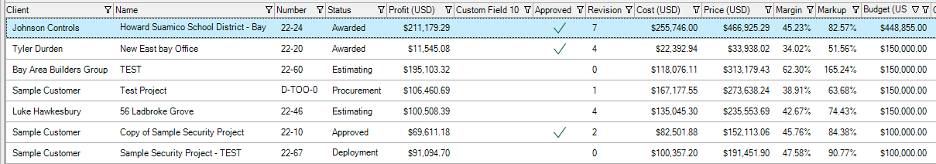
Shown above here is snapshot of a Custom Layout from the Project Explorer that yields (at a very quick glance) where exactly your team’s sale numbers are in relation to the budget entry in SI.
Sending this data out to CSV via an export of such a Custom Layout will then allow you to apply formulas and to perhaps award the top contributor who consistently closes above the budget threshold.
And there it is! A truly essential and worthwhile set of tools from SI to help your team measure (and hopefully) improve your KPI’s and various team metrics.
A Perspective
While organizational and operational efficiency can be (and is usually) challenging and difficult, one cannot say enough about the ally you have in the D-Tools SI platform. With regard to best practices and preferred methods, when it comes to such KPI’s and metrics, SI offers multiple utilizations that can be the make or break aspect of your team’s assessment of success. Refining and maximizing these utilizations will go a long way to measuring your team’s achievements as well as providing direction for the areas that need attention.
Ultimately you (along with your appointed team members) have the reins to control whether or not SI is the dynamic data platform you seek for such evaluations but, suffice it to say, I have seen it deliver the exact details that many teams consistently seek.
In Summation…
-Use SI’s feature set to assess your Key Performance Indicators, for not only sales, but also other areas of your operation.
-Leverage SI’s valuable tools to review metrics for how your team consistently adheres to various directives related to estimating, procurement, deployment, and service.
-Use the above suggestions to increase your revenues and solidify all things great that ye seek!
With all of that said, there’s still plenty more in store for you with SI and forthcoming product releases so keep an eye out for future updates.
As always, we are reviewing your Feature Requests to determine our best step forward and next course of action with future SI product releases so…“keep’em coming”!
In closing…
For more information on these and other features of SI v20, please see this link: D-Tools v20. You can also review our other videos and our usual support documentation.
You can also get more detailed information about v20 via our upcoming webinars and by enrolling in SI training with our PSG team. Please see this link here for our recent “What’s new in v20” webinar.
And don’t forget, that’s why we are here…to ensure your success with our product! Be sure to check back here next time for more on v20!!!