
How much revenue is outstanding? Find out with a simple click from SI’s Job Cost report module!
Continuing in our presentation of new System Integrator (SI) features in the latest product release, v18, this article will focus on the Job Cost reporting aspect now live within the Project Explorer. We will look at the Backlog aspect of this software. This seems like a logical follow up from our prior articles on our other new report features - Job Costing and Revenue. Click here or here in case you missed those.
What is backlog? Simply put, your team’s backlog is the amount of revenue not realized due to its inability to be billed. This can be a most pressing stream to tap for many teams, and understanding any project’s outstanding billable amount is how SI aims to help.
This is one of those methodologies in SI where entering the exact product and labor cost/selling price values, along with timesheet entries from your field techs, really has a maximum effect. This reporting feature will allow you to leverage your specific project data to get an accurate and complete understanding of what is potentially holding up your outstanding funds on any given job.
What exactly is a Backlog report?
From SI’s perspective, a backlog repot is a job cost report that focuses exclusively on your project’s potential revenue that has yet to be billed or collected. This evaluation will analyze your estimated versus the actual cost of all items in an SI Project, which includes all products and labor entries.
Where to Start?
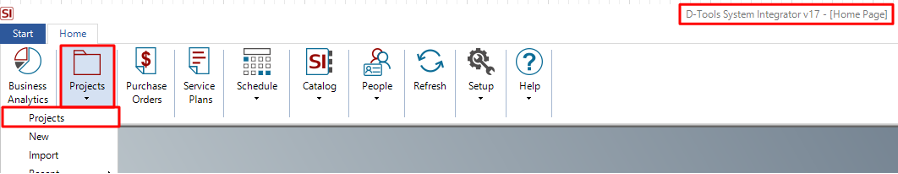
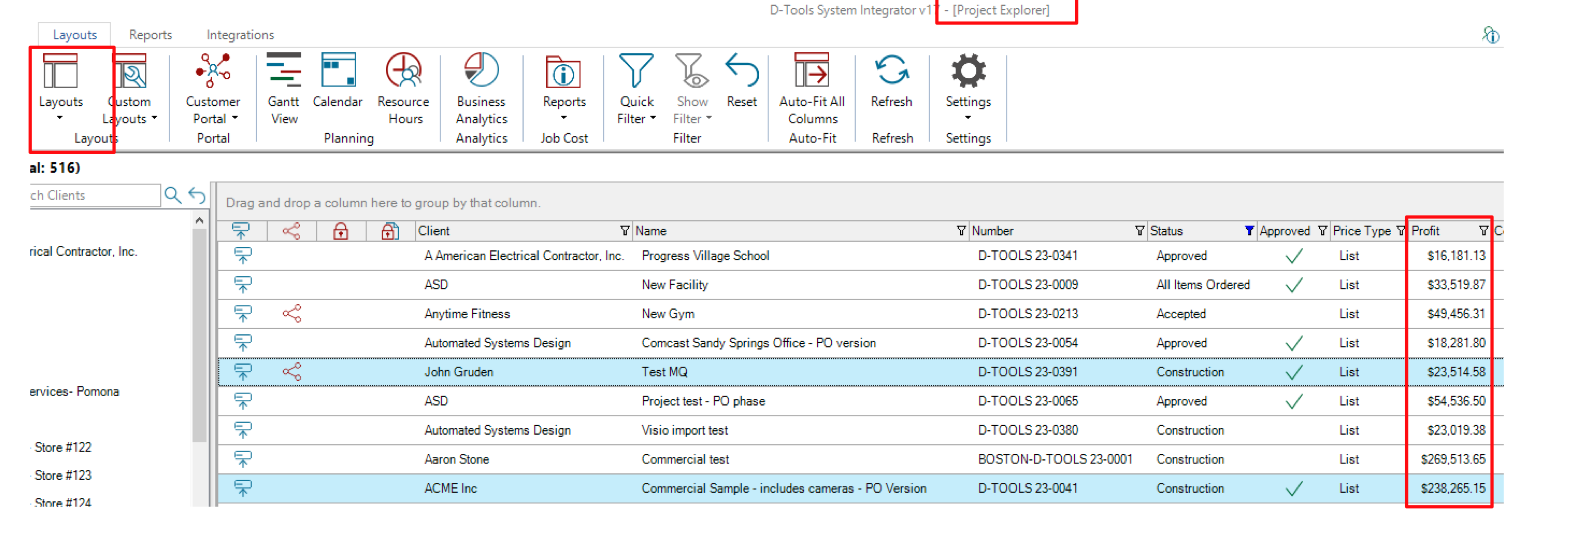
To access this report, you will need to proceed to the Project Explorer that can be launched directly from the Home Page of SI.
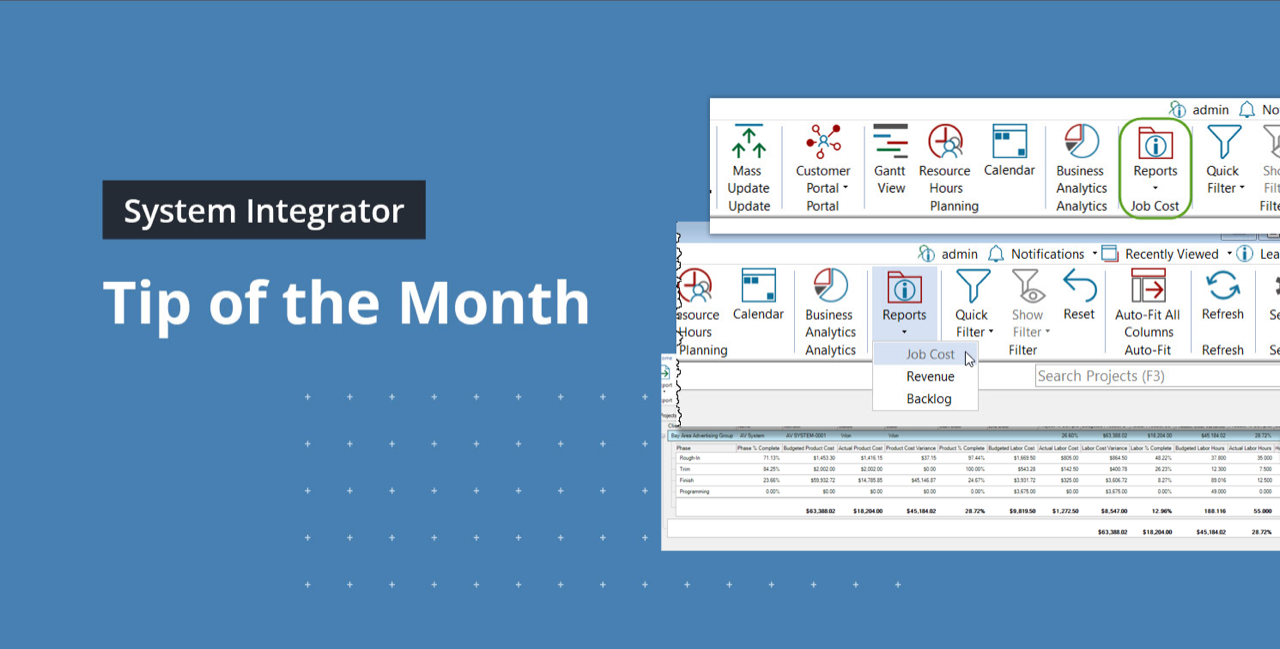
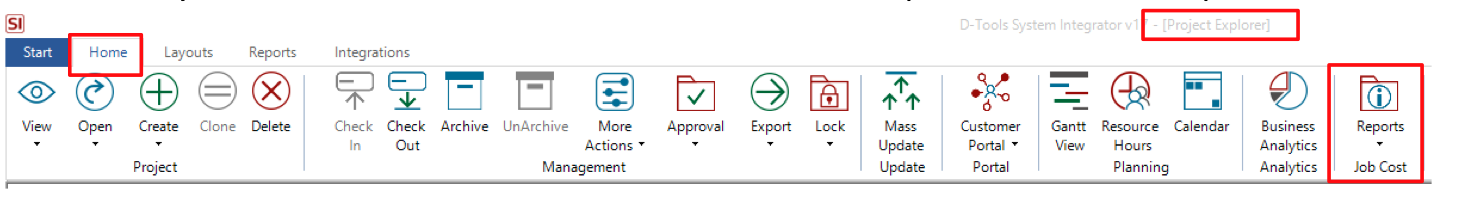
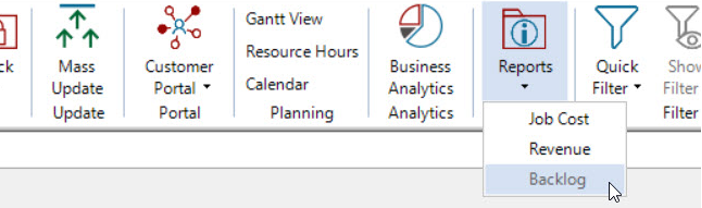
Once there, you will see the icon in the Home ribbon labeled Reports in the Job Cost partition:
From the “dropdown” there, just select “Backlog”.
Before running this report, you will need to select at least one preferred project so that the appropriate data can be loaded. Meaning, that if you run this report on Projects that have yet to commence, you may get some zeros in your display. Keep in mind that you can highlight multiple projects to see results for multiple jobs.
Once the appropriate project choices have been made, left-click on the Reports – Job Cost icon and select Backlog to see a result something like this:

Now, as usual, there is a lot to look at with some data presentations in SI. So, before diving in, let’s step back and review a couple of options and/or settings.
First and foremost, the Job Cost Settings icon: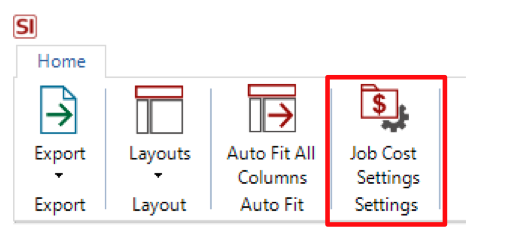
Here you will see an option to determine when values will be applied to the included report data.
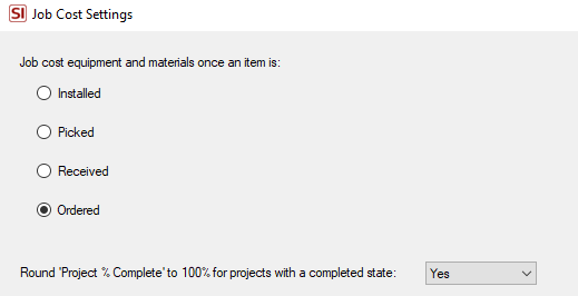
Labeled such as they are within SI, one could look at this in terms of when exactly do, as a company, incur the cost of payment with regard to the items in any given job. Is it when they are ordered, received, picked, or installed? This is somewhat of a reverse order presentation from top to bottom in terms of the flow of events. Consult with your internal accounting team to determine what may be the best option here if you are unsure.
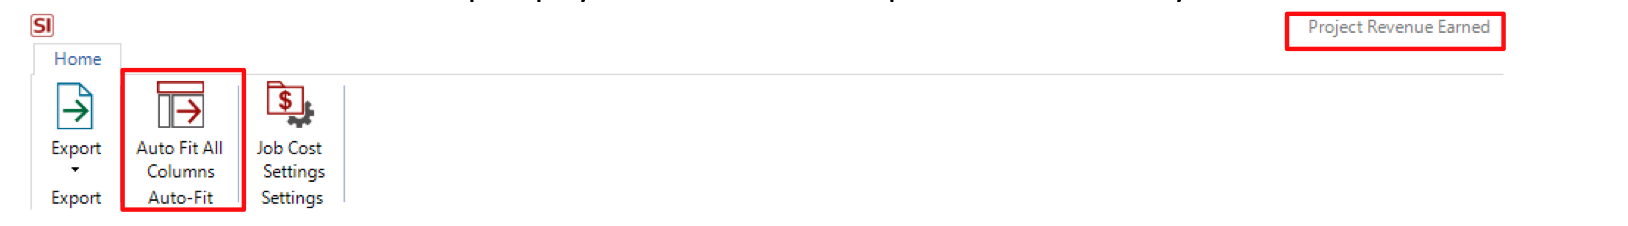
Further, as with other areas of SI data presentation, you will be best served by clicking on the ubiquitous Auto-Fit all Columns icon to help display the data in a more optimized format for your screen.
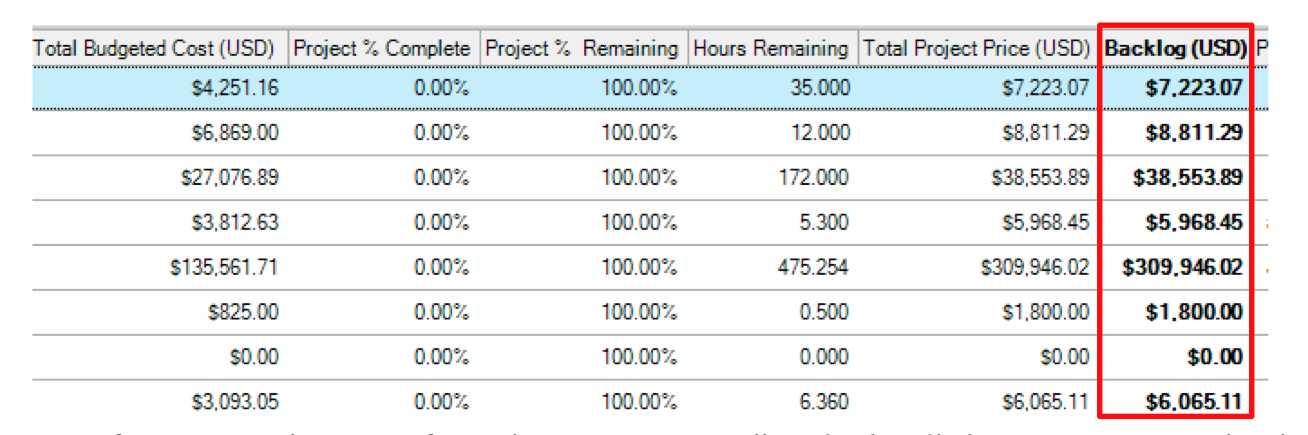
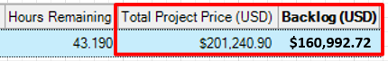
You can then start to dive deep into the presented data and conduct your analysis on any one of multiple points of interest (namely Backlog):

So why does all of this matter?
This much sought-after feature enhancement within SI now provides timely data and analysis directly from values populated into an SI Project, Time Sheets, and our Mobile Install platform. It also now keeps all this data “home” within SI so that you don’t need to export this data outside of SI (although you can, of course).
As I am sure you have all heard and read before, revenue is paramount to your team’s success in this industry. Determining what is holding-up income can be vitally important to projecting income.
Even if you are in this game for a short time, you will undoubtedly know it is essential to have a good idea of your overall operational cash flow and what is to be expected in both the long and short term.
Let us take a closer inspection at some of the data fields that can contribute to this endeavor.
Product cost via Purchase Orders and Labor cost via Time Sheets will yield interesting numbers as soon as items are marked for Job Cost application in the Job Cost Settings and hours from the field techs are approved.

What is great about this is that once these values are updated, we can then see the amount that is outstanding to be billed versus what has yet to be ordered or installed.
If we can procure the items and get them deployed to the project site for either delivery or installation, we can invoice for the outstanding Backlog amount.
Don’t forget that such data extraction is a critical process of SI v18. We recently added Profit as a data column in the Project Explorer to save you from going deeper in the Job Costing report. Just change your Project Explorer Layout to Price and enjoy!
For some of us, it will only be after hours of back and forth with a client, weeks of POs, and perhaps months of installation deployment time that these numbers will start to take shape. However, you can sometimes get the transitional data you need while a job is in progress, as you are ultimately awaiting completion to see the final bottom line.
Well, there you have it! The latest in D-Tools SI v18 analysis and innovation!
As always, we are reviewing your Feature Requests to determine our best step forward and next course of action with future SI product releases so…keep’em coming!
Hopefully, this presentation of just some of the many recent feature additions to SI will not only improve your team’s efficiency and effectiveness, but will also keep the needle moving in the right direction as you tackle all the challenges of this year. As always, we will continue to present new features from our latest release (v18) to enable your team to get more and more out of D-Tools System Integrator software.
Please check back later for future blog entries!
In closing…
For more information on these and other features of SI v18, please see this link: S-Tools v18. You can also review our other videos and our usual support documentation.
You can also get more detailed information about v18 via our upcoming webinars and by enrolling in SI training with our PSG team.
And don’t forget, that’s why we are here…to ensure your success with our product! Be sure to check back here next month for more on v18!!!